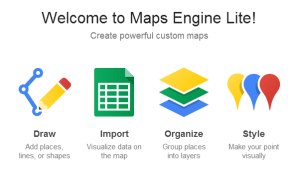
Google Maps Engine Lite lets you import and map data if the data source contains location data. It is also connected to your Google Drive, so you can use Google Spreadsheets as your data source.
Pam Womack, an Instructional Services Technical Assistant, was nice enough to extract school names and addresses out of a database. I had to split the data between three spreadsheets, because Google Maps Engine Lite takes only the first 100 items in a spreadsheet. Here are the Google Spreadsheets that I used to create the map:
You can view the map here: http://mapsengine.google.com/map/view?mid=zipRIUD_FzvI.kHdDzwtJL2lk
You can embed your map on other pages, like this...
You can embed your map on other pages, like this...
You can also extract a KML file to visualize your data in Google Earth.
My map is pretty simple--it just has names of buildings and street addresses. But, a person could easily add data to the spreadsheets, and color-code the map markers according to the data. For instance, the literacy team could enter which building are participating in various initiatives, and easily visualize that data on a map.
There are lots of possibilities, and the tool is pretty easy to use.